The Digital Era, and the artificial intelligence influx that has come with it, has completely renovated the way we work today in industries all over the world. One of the major areas that have been impacted by this revolution is the research and academic field. Now that Big Data has become a household term, scholars are able to collect massive amounts of data on almost any topic they need.
Collecting these large amounts of data has a lot of benefits that come with it, but there are also disadvantages. Researchers are able to see a bigger picture of their topics, but they also are dealing with numbers that are difficult to work through and very hard to represent to the reader. When a number is something the average person can relate to, statistical data can be displayed easily. But once those numbers hit the big digits, it becomes a complex concept that is hard to demonstrate in ways the reader can comprehend. However, that is exactly what the author’s goal must be.
Why is Data Important to a Concept?
Data is the term for a set of facts that show a snippet of the reality of a concept. The data that is collected might have been obtained for a specific purpose or it could have been retrieved with the intent of being stored until it was necessary for analysis.
Most types of data are given to researchers in raw formats that need to be applied in order to be useful. The raw data is first summarized and sorted into categories, labeled, organized, and then analyzed. It is then presented with a specific methodology behind it in order for it to make sense for the purpose in which it is being used. This planning component should be the first step a scholar starts with before they even begin to process the raw data because it determines what information will be important to help explain the concept in question.
The Rules for Sharing Data With Your Reader
Data sharing that makes perfect sense to you might not be so clear to the reader. And it’s the reader that has to understand the concept you’re presenting in order for your work to be impactful.
When you’re sharing data, keep these rules in mind:
● Make sure the question for which you used data to find an answer is well-defined and clearly presented in your research before you begin discussing the statistical results.
● Use concise but wholly transparent explanations of your thought process and actions as you summarized the data, including why you chose the method you did to organize it and the results you got as you analyzed the data.
● Include any aspects of the data preparation process that might have an impact, however insignificant, on the way the data was represented. This could include things like changing the level of a factor, coding adjustments, transforming variables or data, and removing noise or outliers.
Keep the end outcome in mind and be sure that you’re building a clear picture for the reader as to how you used the data to get to that point.
Methods to Present Statistical Data
The crucial thing to remember as you determine how you’re going to present your data is that the simpler it is, the better. Keeping it concise and clear not only helps your reader understand the concept, it also helps the web crawlers find your work and display it on search engine results.
Whatever method you choose, be it text, tables, or graphics, make sure you start with a generalized number and then become more specific as you continue the display. Reiterate the research question and bring in the statistical data that answered it. Use past tense when you’re describing your results and make sure not to repeat any information in multiple formats.
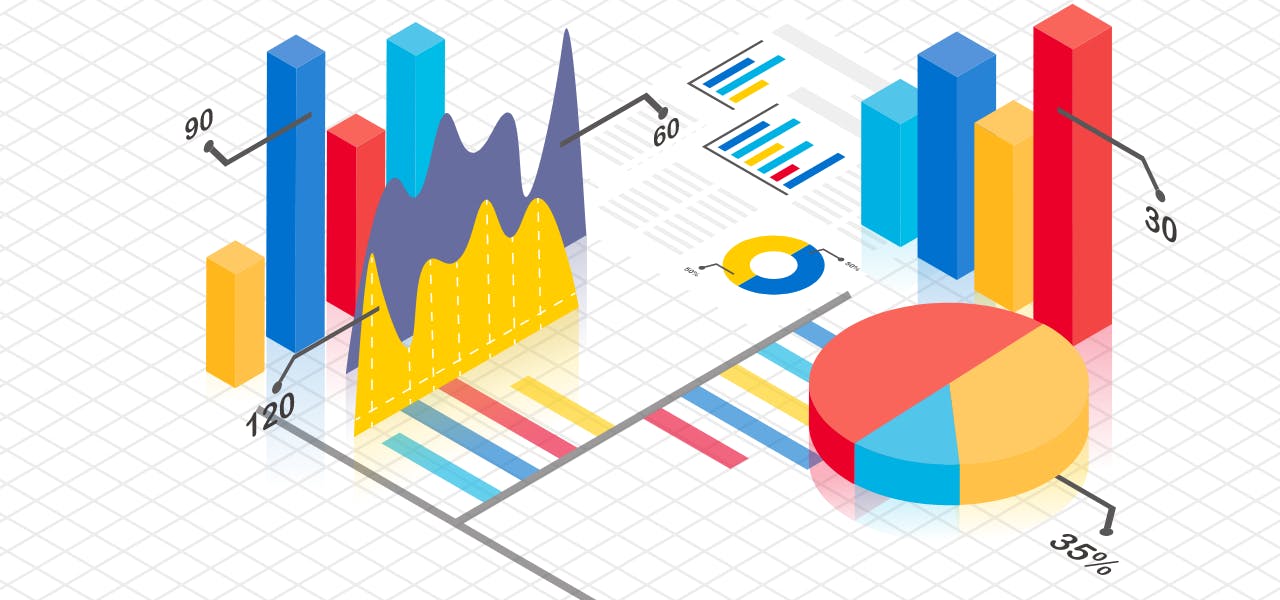
Text presentations are good for explaining simple, one-idea concepts. Tables are the preferred way to present data with multiple ideas behind it because you can use rows and columns with headings. Graphics are commonly used when you want to showcase an inference from the data that might not be seen by a table or basic representation.
Each method has its strengths and weaknesses, and the one you choose should be based on the data you analyzed and the outcome you achieved.


